
BPFO MATCH
A
B
C
D
ISO 10816-3 · Zone Classified
Solution · Condition Monitoring

Know Which Bearing Is Failing, and How Long You Have

Register a machine’s rolling-element geometry once. From then on every vibration reading is checked against its calculated fault frequencies — BPFO, BPFI, BSF and FTF — classified against ISO 10816-3, scored for health and projected to a remaining useful life with a confidence band. All of it on-premise.

The Challenge & The Solution

A Vibration Reading Is Not a Diagnosis

Most condition monitoring stops at a number going up. The chart trends, somebody notices, and the conversation becomes an argument about whether it means anything. Meanwhile the analyst who could read a spectrum retired, and the vendor software that came with the sensors exports a PDF nobody opens. Trend data without a fault model is just an expensive way to be surprised.

SmartX HUB computes the frequencies a specific bearing would fail at, from its own geometry, and matches measured spectra against them within tolerance. A match becomes a typed diagnosis with a confidence score — not an alert saying “vibration high”. From there the Criticality Matrix says whether this machine is worth interrupting production for, and one click opens a work order in work order management with a suggested failure code and the spare parts already proposed.

Fault Frequencies

Calculated From Geometry, Not Guessed From a Trend

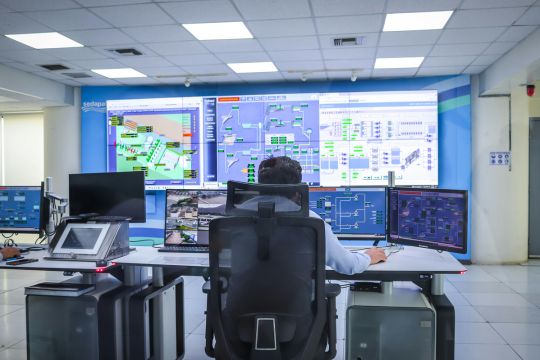
A rolling-element bearing fails at frequencies determined by its own geometry — outer race, inner race, ball and cage. Register that geometry once and the platform computes BPFO, BPFI, BSF and FTF for that specific bearing, then matches every measured spectrum against them within tolerance: ±5% on velocity, ±3% on envelope. The output is not "vibration is high". It is a named fault type with a confidence score, deduplicated per asset so the same condition does not re-fire on every polling cycle.
Smartx HUB Cond Monitoring 540 x 360 1
The Benefits

Stop Guessing at What the Chart Means

Condition monitoring earns its budget when it produces decisions, not dashboards. Five outcomes stand out.

01
A Named Fault, Not an Alarm
Ten fault types diagnosed automatically with a confidence score — the difference between knowing what is wrong and knowing something is wrong.
02
Planned, Not Reacted To
Remaining useful life with a confidence band turns an emergency into a scheduled shutdown you can staff and stock for.
03
Priority You Can Defend
The Criticality Matrix plots criticality against health, so the machine you stop production for is the right one.
04
Knowledge That Stays
Causal chains and plain-language narratives mean the diagnosis does not leave when the analyst does.
05
Nothing Leaves the Plant
The analysis and the AI copilot run on premise, so spectra and machine data stay inside your own infrastructure.
Decision Support

The Analyst You No Longer Have

Reading a spectrum is a scarce skill and it is getting scarcer. These six exist so a plant without a resident vibration analyst can still act on what the data says.

RCA
Causal Chain
A deterministic chain — root cause to effect to effect to symptom — per fault type, so the reasoning is inspectable rather than a black box.
NLP
Plain-Language Narrative
An AI-written explanation of the likely failure mode and recommended actions, for the people who do not read spectra.
BOT
Maintenance Copilot
A conversational assistant carrying full machine context: configuration, recent readings, open diagnoses, health score and RUL.
P90
Fleet Benchmarking
Global percentiles — P25, P50, P75, P90 — by machine type, ISO class and mount type, so an asset is judged against its peers.
ID
Machine Passport
Manufacturer, model, power, voltage, efficiency class, installation date and warranty, plus every upgrade with before and after RMS.
PDF
Condition Report
A per-machine report for the file, the auditor or the vendor conversation — generated, not assembled.

Notification rules on zone change, new fault or RUL threshold feed the platform-wide alerting engine — deduplicated, so the same condition does not re-fire every cycle. See monitoring and alerts.

Start with your ten worst machines

Register their bearing geometry, feed three months of readings, and see which ones the fault-frequency match flags. That list against your failure history is the whole argument.

FAQ

Condition Monitoring — Common Questions

Answers to the questions we hear most from reliability and rotating-equipment teams evaluating condition monitoring with SmartX HUB. Have another question? Reach out through our support center.

What is the difference between condition monitoring and predictive analytics?
They answer different questions. Predictive analytics looks for anomalies across sensor data generally — something is behaving unusually. Condition monitoring here is specific to rotating equipment: it computes the frequencies a particular bearing would fail at, from its own geometry, and checks whether the measured spectrum matches. One flags strangeness; the other names the fault.
What are BPFO, BPFI, BSF and FTF?
They are the characteristic fault frequencies of a rolling-element bearing: ball pass frequency outer race, ball pass frequency inner race, ball spin frequency and fundamental train frequency. Each is determined by the bearing geometry — element count, diameters, contact angle — and each corresponds to a different failure mode. Register the geometry once and the platform calculates all four for that bearing, then matches measured spectra within ±5% on velocity and ±3% on envelope.
Do we need a vibration analyst on staff?
That is precisely what this is built around. Diagnosis is automatic across ten fault types with confidence scoring, and an AI root-cause panel produces a deterministic causal chain — root cause to effect to symptom — with a plain-language narrative and recommended actions. A maintenance copilot carries full machine context for follow-up questions. The scarce skill is encoded rather than hired.
What is ISO 10816-3 and why does it matter?
It is the standard that classifies machine vibration severity into zones A, B, C and D by machine class (I to IV) and mount type, from measured RMS velocity. It matters because it gives a shared vocabulary: "zone C" means the same thing to your team, your insurer and your equipment vendor, where "vibration is elevated" does not.
How is remaining useful life calculated?
By linear regression on the RMS trend slope, returned with a confidence band. It is deliberately a simple, inspectable model rather than an opaque one — the band is as important as the number, because a wide band is itself information about how much data you have.
Can we use our existing vibration sensors?
Yes. Waveform and FFT data comes in over HTTP, MQTT or manual upload, and a vendor-profile decoder normalizes hardware payloads. You are not locked to a single sensor brand, and existing installed hardware can usually feed the platform rather than being replaced.
How does a diagnosis become actual work?
One click. A diagnosis creates a work order directly in the maintenance flow, carrying a suggested failure code and suggested spare parts. The Criticality Matrix — criticality 1 to 5 against health score, in four quadrants — is what decides whether that work justifies interrupting production. See work order management.
Does our vibration data leave our infrastructure?
No. The analysis and the AI copilot run on premise. Spectra, machine configuration and diagnoses stay inside your own environment — which is usually the deciding factor in defence, pharmaceutical and government sites.
How do we know if a machine is bad, or just typical for its type?
Fleet-percentile benchmarking. Every machine is scored against P25, P50, P75 and P90 for its machine type, ISO class and mount type. A reading that looks alarming in isolation may be normal for that class — and one that looks acceptable may be in the worst decile of its peers.
What does the Machine Passport hold?
Manufacturer, model, power, voltage, efficiency class, installation date and warranty, plus a documented history of every upgrade and intervention with before and after RMS. That last part is what turns a repair record into evidence that the repair worked.

Explore our blog for insightful articles, personal reflections and ideas that inspire action on the topics you care about.
Inventory RFID Asset Management 540 x 360 v5 023

Healthcare: Location Intelligence for Cleaning Services

What is RTLS? A Complete Guide to Real-Time Location Systems Real-time location systems (RTLS) track the location of assets,... read more
Inventory RFID Asset Management 540 x 360 v6 011

How Much It Costs You Not to Know Where Medical Assets Are

How Much It Costs You Not to Know Where Medical Assets Are Introduction In today's healthcare environment, operational efficiency directly impacts both patient... read more

Iot RFID CMMS Inspection 540 x 360 v1 047

Stop Losing Your High-Value Tech: The ROI of Real-Time IT Asset Tracking

Stop Losing Your High-Value Tech: The ROI of Real-Time IT Asset Tracking Introduction Building Intelligent: Real-time IT asset tracking For many... read more

Inventory RFID Asset Management 540 x 360 v6 017

Discover the Full Potential of Your RTI Management

Tracking returnable transport items (RTIs) with RFID Introduction Optimize your logistics with advanced RTI Tracking: gain unparalleled visibility, streamline asset management, and... read more

error: Content is protected !!