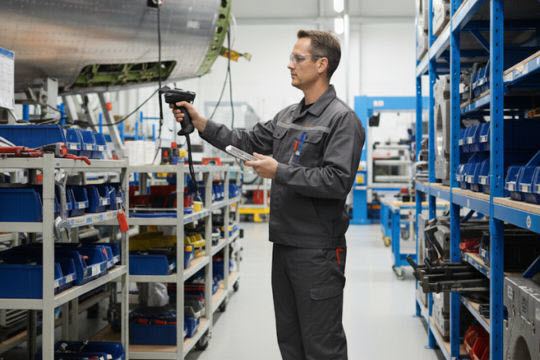
Every Pallet · Located & Counted
Industry · Warehousing & Distribution

Smarter Warehouses. Real-Time Visibility. Flawless Execution.

SmartX HUB brings AIoT, RFID, and RTLS together on one platform — giving distribution centers real-time visibility of every item, pallet, vehicle, and worker, from the receiving dock to final delivery. Faster, more accurate, with fewer errors.

Digitize Your Distribution Center

Accelerate Warehousing and Distribution Operations

SmartX HUB's tracking solutions improve the visibility of items throughout the supply chain, benefiting both the customer and the supplier. The platform is built to boost workforce productivity, enhance real-time visibility of assets and inventory, and help warehouses meet growing customer expectations.

By connecting people, processes, and systems, SmartX HUB enables warehouses and distribution centers to operate faster, more accurately, and with fewer errors — streamlining workflows, reducing manual effort, and driving higher efficiency across the entire supply chain.

Core Capabilities

Built for Warehousing Excellence

Nine connected capabilities, one platform. Each maps to a dedicated SmartX HUB solution — click any capability to see how it works in detail.

Real-Time Inventory Tracking
Monitor item-level inventory movement across receiving, storage, picking, staging, and shipping using fixed RFID readers and handhelds.
Explore inventory management
Inbound & Outbound Verification
Automate dock-door and gate reads to confirm incoming and outgoing goods instantly, eliminating manual scan errors and paperwork.
See supply chain automation
RTI & Pallet Tracking
Track reusable racks, bins, and pallets to reduce losses and optimize circulation. Get alerts on idle RTIs and turnaround delays.
Track returnables & pallets
Workflow Automation
Digitize warehouse processes — from putaway to replenishment to dispatch — with intelligent rules and event-based triggers.
Automate staff workflow
RTLS & Geofencing
Track items, people, and vehicles using BLE and GPS-enabled tags. Define zones to trigger alerts for unauthorized movement or dwell time.
Explore RTLS tracking
Risk Management
Performance analytics and real-time asset operational status give a clear view of the operation and support accurate risk assessment.
Explore incident management
Tool & Fixture Tracking
Track usage, movement, and calibration status of critical tools and fixtures with RFID smart cabinets. Prevent halts from missing tools.
See smart cabinets
Condition Monitoring (IoT)
Monitor temperature, humidity, vibration, and more to protect sensitive goods. Receive alerts before failures occur, not after.
Explore IoT monitoring
Workforce Safety & Certification
Use RFID badges and zone tracking to verify personnel in restricted areas and confirm certifications before equipment use.
See access control & safety
SAVINGS ▲ · COST ▼
Value Up · Cost Down
Manufacturing · Business Case

Manufacturing RFID & RTLS ROI: How to Build the Business Case

A tracking project doesn't get approved on features — it gets approved on numbers. This guide gives you a practical framework to calculate the ROI of an RFID or RTLS investment, built from your own operation's data, not vendor promises.

11 min read Business Case series
The Short Answer

How Do You Calculate RFID ROI?

Quick Answer

You calculate the ROI of an RFID or RTLS project by adding up the annual savings it generates across five value levers, subtracting the annual cost of the system, and dividing by that cost. The key is to build every number from your own baseline data — measure the current process first, then the improved one, and use the difference.

ROI (%) = (Annual Savings − Annual Cost) ÷ Annual Cost × 100

Most tracking projects fail to get funded not because the value isn't there, but because the business case is built on generic claims — "reduce downtime by X%" — that a CFO can't verify. A credible business case does the opposite: it starts from what your operation loses today, in hours and dollars, and shows what changes.

That's the difference between a pitch and a proof. The framework below breaks the return into five levers. You won't have all five in every project — most cases are carried by two or three — but walking through each ensures you capture the full value, and gives you defensible numbers to put in front of finance. This applies across the full set of RFID and IoT manufacturing processes.

The Framework

The Five Value Levers

Every dollar of return from a tracking project comes from one of these five sources. For each, capture a baseline, estimate the improvement, and annualize it.

1
Labor Efficiency
The hours your team spends searching for assets, counting inventory, auditing, and reconciling data manually. Automatic tracking eliminates most of this — freeing skilled labor for productive work.
Hours saved per week × loaded labor rate × 52 weeks
2
Loss & Shrinkage Reduction
Tools, returnable containers, and assets that go missing and get repurchased. Custody and anti-loss alerts cut this dramatically — you stop paying twice for things you already own.
Annual replacement spend × expected reduction %
3
Downtime Avoidance
Unplanned downtime is usually the single most expensive event on a shop floor. Predictive maintenance and faster location of assets and tools reduce both the frequency and duration of stoppages.
Downtime hours avoided × cost per hour of downtime
4
Quality & Compliance
Rework and scrap from uncertified tools or process errors, plus the labor of preparing for audits and the risk of failing them. Traceability and calibration control shrink all of these.
Rework/scrap cost avoided + audit-prep hours saved
5
Inventory & Working Capital
Excess safety stock, oversized returnable pools, and obsolete inventory carried because visibility is poor. Accurate real-time data lets you run leaner without risking stockouts.
Inventory reduction × carrying cost rate
A Worked Example

Putting the Framework to Work

Here's how a simplified tool-tracking business case comes together. The numbers are illustrative — the method is what matters. Replace each figure with your own measured data.

Annual Value LeverBasis (illustrative)Annual Value
Labor — less tool searching15 techs × 20 min/day saved$78,000
Loss — fewer repurchasesTool replacement spend down 40%$32,000
Downtime — faster tool availability60 hrs/yr avoided × cost/hr$45,000
Quality — no uncertified toolsRework avoided + audit prep$20,000
Total Annual Savings$175,000
Less: annual system costSoftware + hardware + services−$60,000
Net Annual Benefit$115,000
ROI
192%
Payback
~4 mo
Net / Year
$115K
Illustrative figures. ROI = (175,000 − 60,000) ÷ 60,000 × 100 = 192%. Your numbers will differ — which is exactly why you measure your own baseline.
The Other Side of the Equation

What Goes Into the Cost

A credible business case is honest about total cost of ownership, not just the sticker price. Account for all of it so the ROI holds up under scrutiny:

Hardware
Tags, readers, gateways, antennas, and smart cabinets — a one-time capital cost, plus tags for new assets over time.
Software & Platform
The platform subscription or license that turns raw reads into dashboards, alerts, and integrations — usually annual.
Implementation & Integration
Deployment, configuration, ERP/MES integration, and tag application — a one-time services cost to get live.
Training & Support
Getting the team using the system, plus ongoing support and maintenance — small, but real, and worth including.
The Secret to a Believable Number

Measure the Baseline First

The single most important step is also the most skipped: measure your current state before you deploy anything. A business case that says "we save 20 minutes per technician per day" is only credible if you actually measured how long searches take today.

This is why a focused proof of concept is so powerful. Pick one process on one line, measure the baseline — search times, loss rates, downtime, audit hours — then run the tracked version and measure again. The difference is your real, defensible saving, and it scales predictably as you expand. You walk into the funding conversation with evidence from your own floor, not a vendor's slide.

That measured-baseline approach is the backbone of every process in the manufacturing process guide — from predictive maintenance to tool tracking.


Build your business case with real data

Run a focused proof of concept on your highest-pain process, measure the baseline, and get numbers you can take straight to finance. That's how a tracking project gets approved.

Frequently Asked Questions

Manufacturing ROI, Answered

Add up the annual savings across five value levers — labor efficiency, loss reduction, downtime avoidance, quality and compliance, and inventory reduction — then subtract the annual system cost and divide by that cost: ROI = (Annual Savings − Annual Cost) ÷ Annual Cost × 100. The critical step is building each figure from your own measured baseline rather than generic industry claims.

It varies widely by use case, but asset and tool tracking projects often pay back within months rather than years, because the savings — reduced search time, fewer repurchases, less downtime — are large and recurring. Rather than relying on a typical figure, the reliable approach is to measure your own baseline in a proof of concept and calculate payback from your actual numbers.

Four categories: hardware (tags, readers, gateways, smart cabinets), software or platform subscription, implementation and integration services (deployment, ERP/MES connection, tagging), and training and ongoing support. A believable business case accounts for total cost of ownership across all four, not just the hardware sticker price.

Usually because they're built on generic vendor claims — "reduce downtime by X%" — that finance can't verify. The fix is to measure your own baseline first: how long searches take, how much you spend replacing lost tools, how many downtime hours you lose today. A case built on your own data is defensible and far more likely to be funded.

Start by picking the single process costing you the most today, and run a focused proof of concept. Measure the baseline before deploying anything, run the tracked version, and use the measured difference as your saving. This gives you real evidence from your own operation that scales predictably as you expand to other processes and lines.

Keep Exploring

Related Guides

Building an ROI case applies across all 26 processes in our complete guide to RFID and IoT in manufacturing. To dig into specific high-return use cases, see predictive maintenance with IoT, RFID tool and mold tracking, and WIP tracking. To choose the right capture technology for each, the RTLS technologies comparison guide weighs cost, accuracy, and range side by side.

Explore our blog for insightful articles, personal reflections and ideas that inspire action on the topics you care about.

error: Content is protected !!